Dashboards
A Dashboard is a custom metric page composed of widgets. Use it for project status pages, team rollups, billable-hours summaries, customer health, anything that needs a single-screen view.
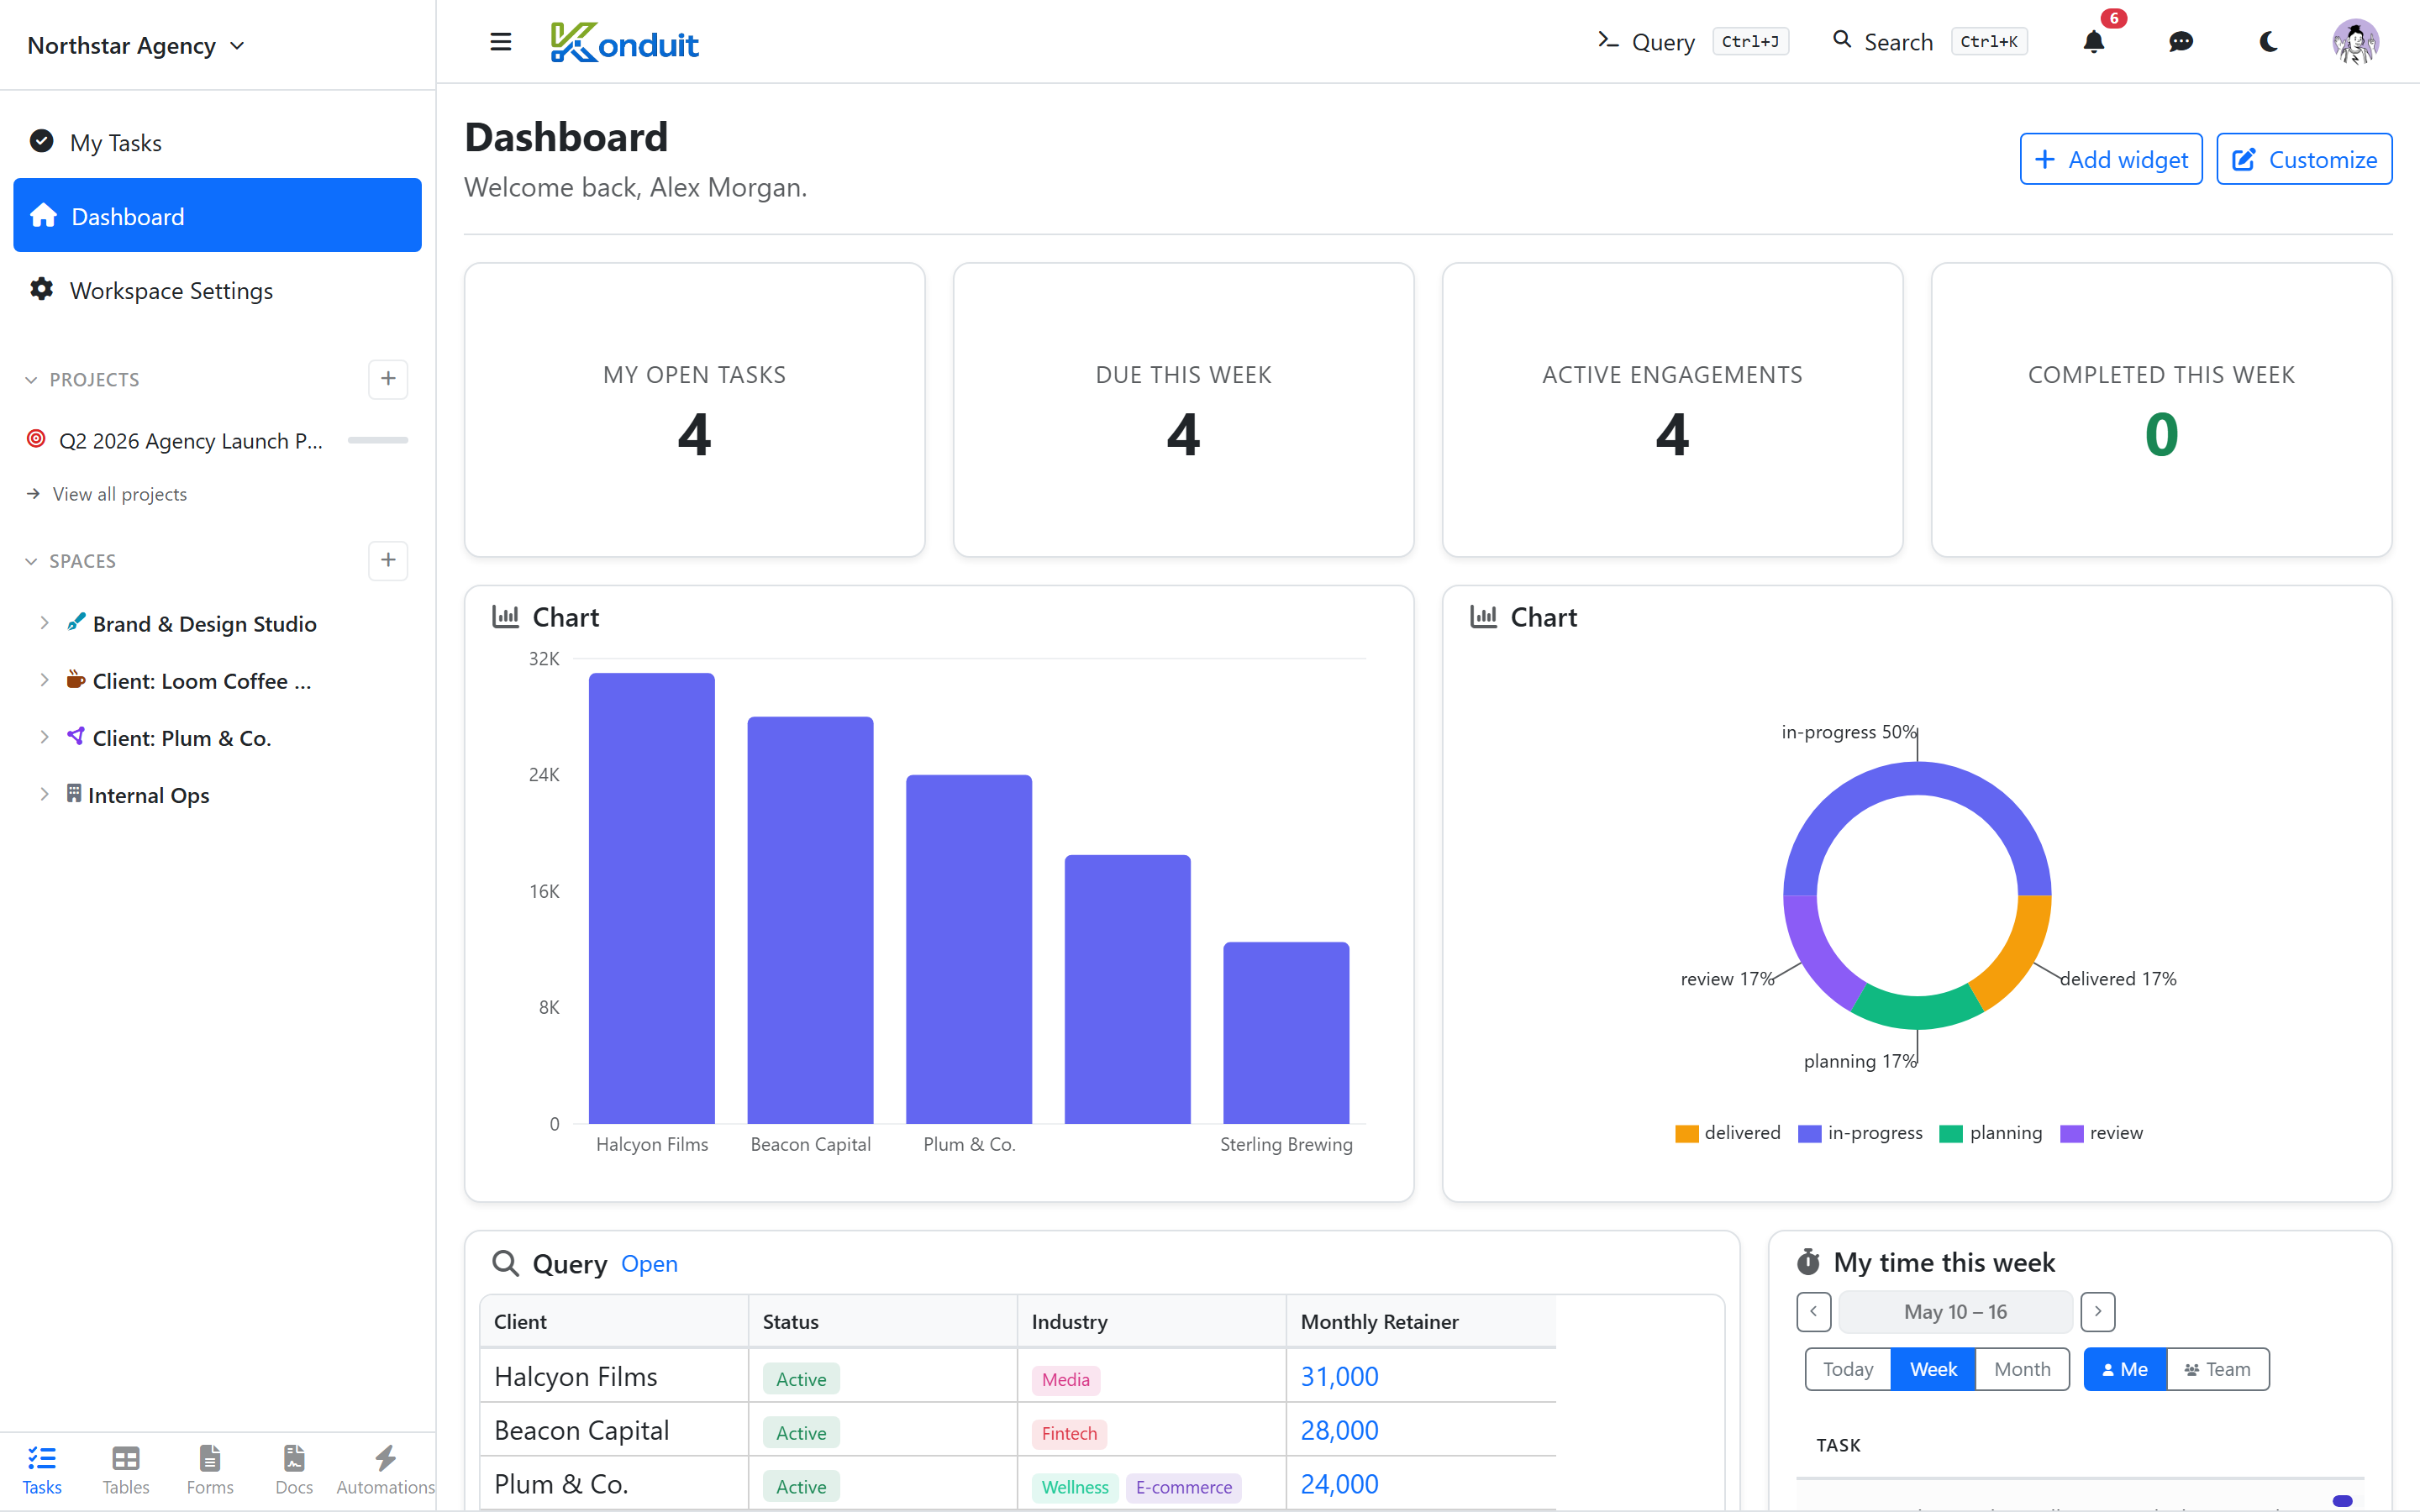
Your dashboard
There is a single, personal dashboard per workspace, opened from Home on the left rail (the house icon at the top). Each user has their own — you can't create named or space-scoped dashboards, and there's no "New Dashboard" action. It ships with a default starter widget layout you can customize.
Add widgets with the Add widget button (top right), which opens a centered picker modal — click a widget card to add it. There's no right-hand panel to drag from.
Widget grid
Widgets snap to a 12-column grid. Resize by dragging corners; reposition by dragging the title bar. The grid auto-rearranges on mobile (single column).
Widget types
The widget types are documented in Widgets. Highlights:
- Task Stat / Data Stat — a single big number for tasks or datatable rows
- Chart — bar, line, pie, or donut from a KSQL query (Konduit SQL)
- Query Result — a query result rendered inline as a table
- Timesheet — tracked-time totals, split billable vs non-billable
- Task Chart — metrics like status breakdown, assignee workload, or completed tasks by person
- Recent Tasks — your most recently created tasks
Sharing
The dashboard is personal to each user — one per user per workspace. There is no sharing or visibility model: no workspace-wide, space-scoped, or private options, and no external sharing.
Refresh
Auto-refresh is configured per widget (Off, or every 1 / 5 / 15 min / 1 hr) and is off by default — there is no single per-dashboard refresh interval and no manual refresh button. The top-right controls are Add widget and Customize (plus a transient "Saving…" indicator).
Plan limits
| Free | Pro | Business | |
|---|---|---|---|
| Dashboard widgets | 10 | 25 | Unlimited |
The default dashboard every workspace starts with ships 7 widgets, which count toward the allowance.
Next
- Widgets
- Scheduled Reports — email a saved query result on a recurring schedule (a Routine)