Gantt
Gantt renders tasks as horizontal bars on a timeline, with dependencies shown as arrows between bars. It's a project-level timeline view — useful for project planning and seeing critical paths. Available on Pro and above.
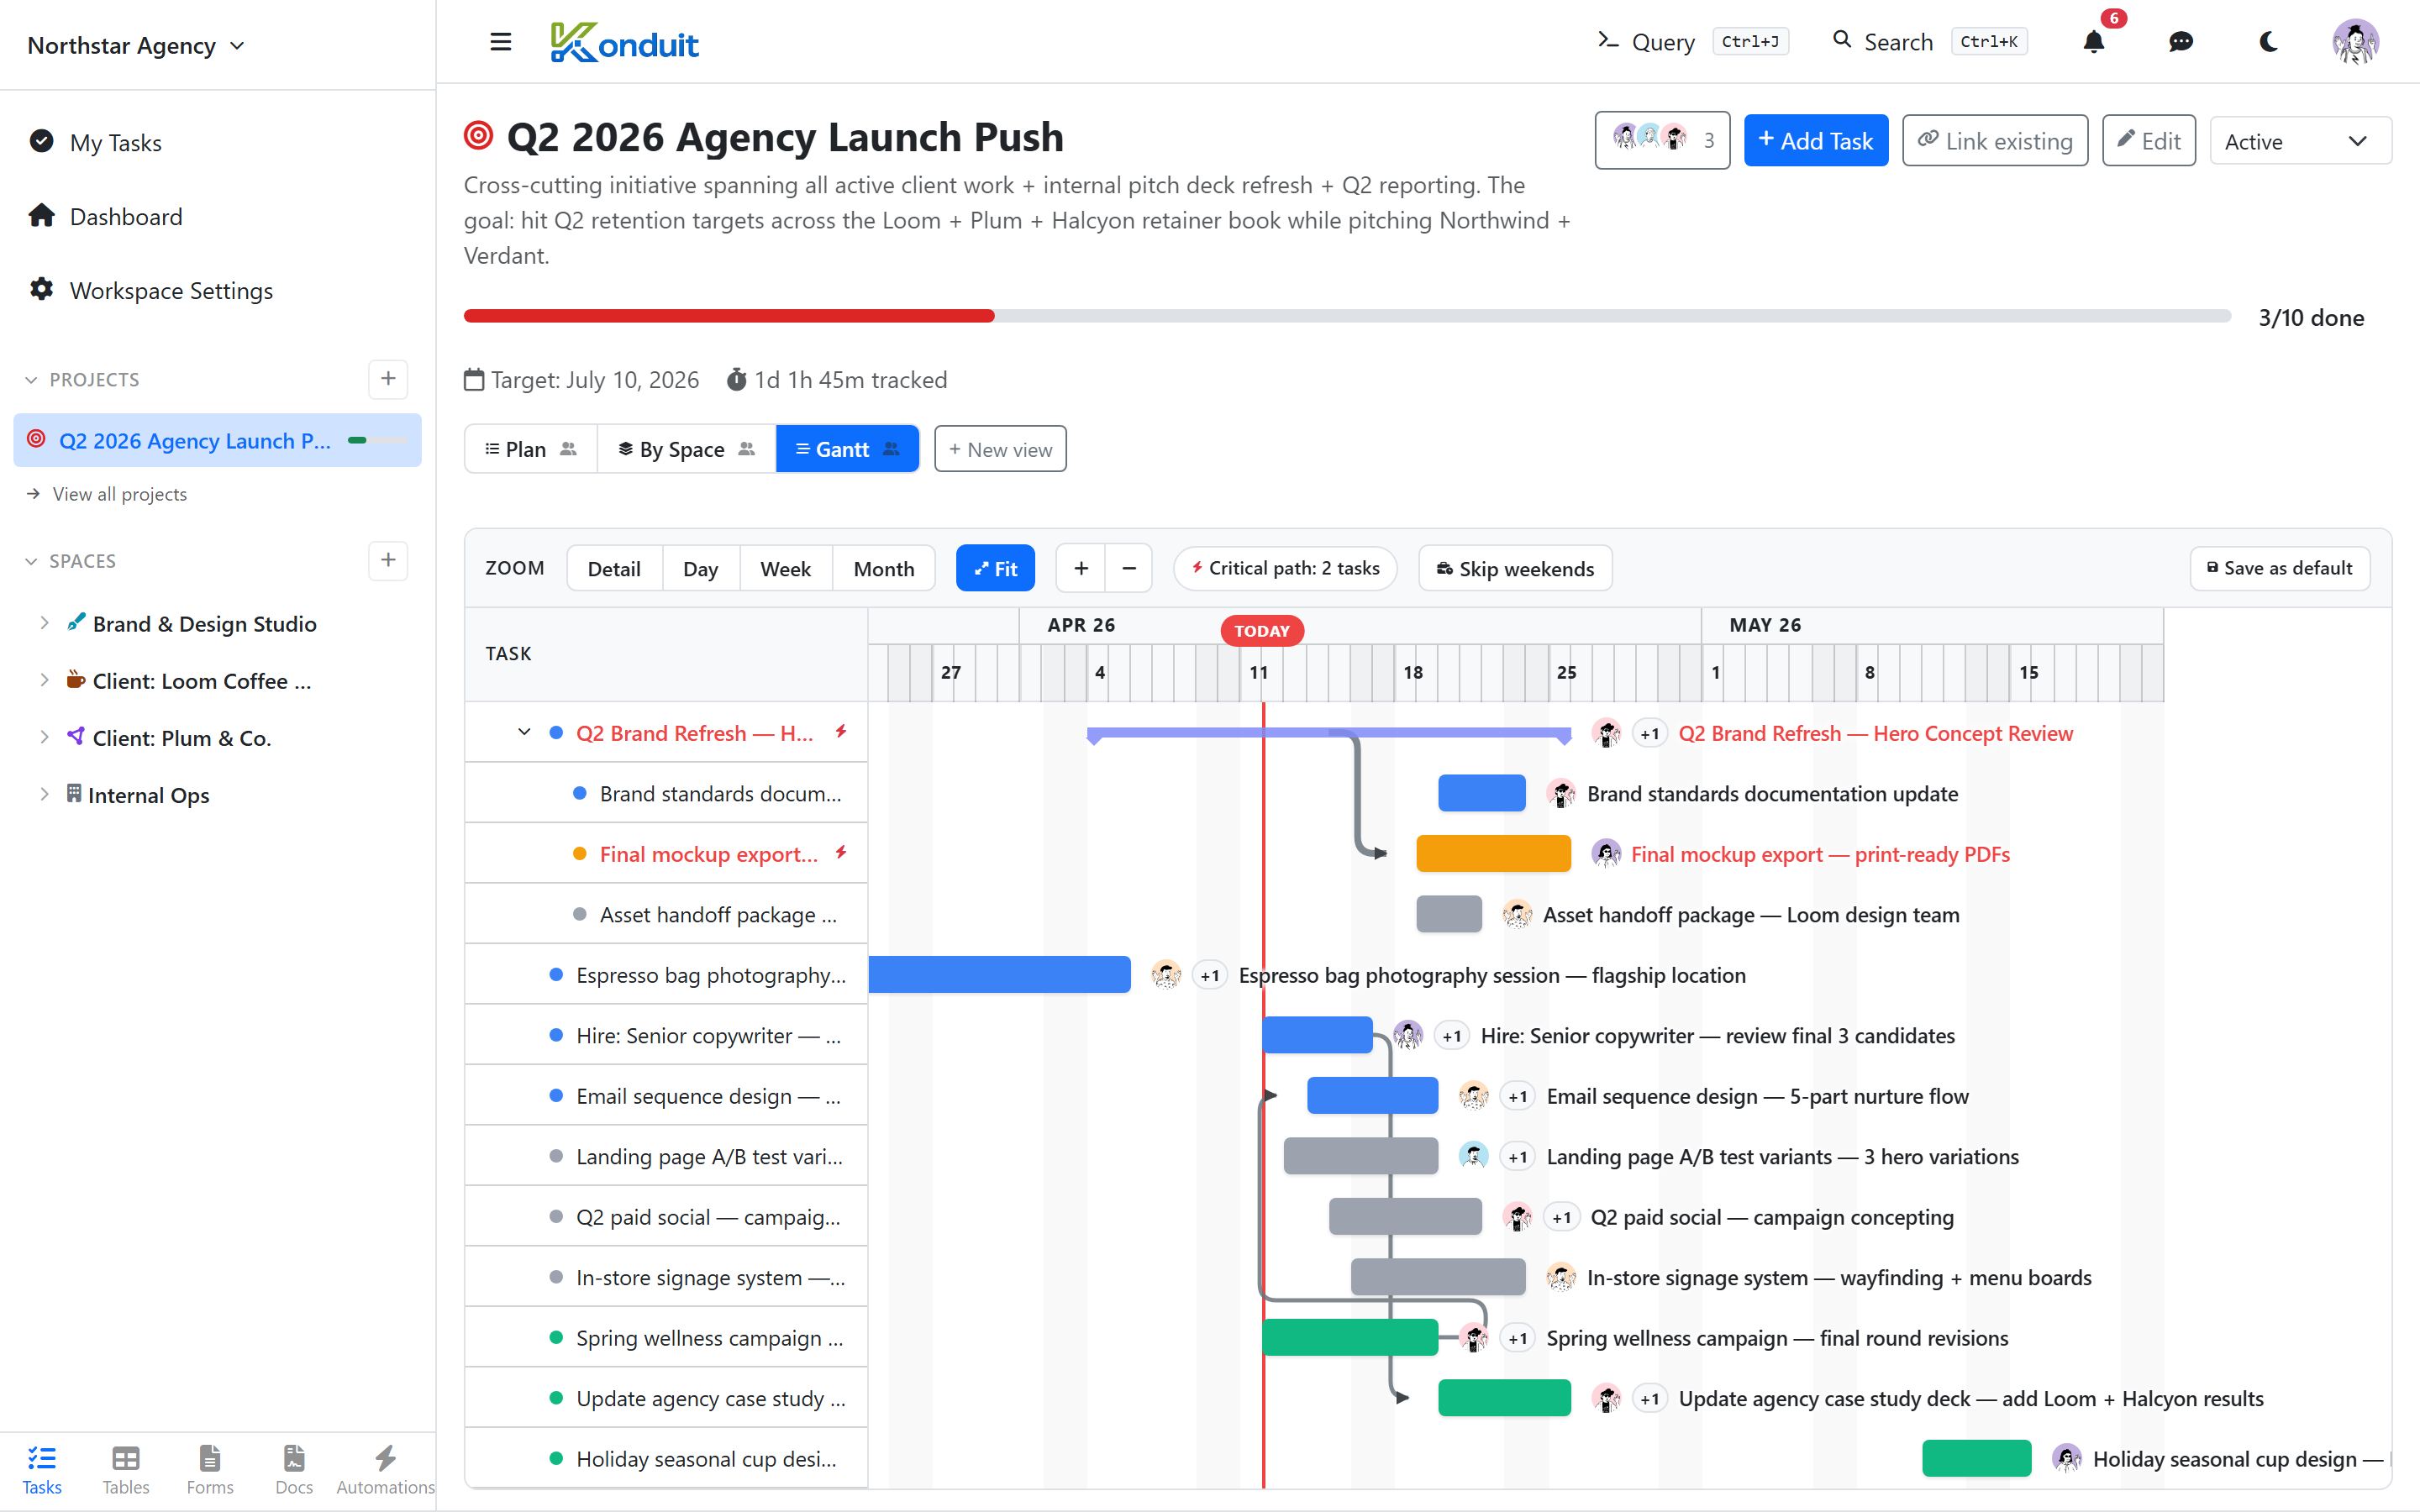
What appears
Tasks need at least a start date or due date to appear on the gantt. Tasks with both render as a range; tasks with only a due date render as a milestone diamond on that day.
Dragging
- Drag the bar body — shift the entire range
- Drag the left edge — change start date
- Drag the right edge — change due date
- Drag the name column — reorder rows
Dragging only moves/resizes existing bars, draws dependencies from bar edges, or reorders rows — there's no drag-in-empty-space task creation.
Zoom levels
The toolbar offers four zoom presets, plus a Fit button and a +/- stepper for fine control.
| Zoom | Best for |
|---|---|
| Detail | Hour-level detail, tightly-scheduled work |
| Day | Sprint planning, near-term work |
| Week | Multi-week initiatives |
| Month | Quarterly and roadmap-level views |
Dependencies
Drawn as arrows from "blocking" → "blocked by" task. Drag from the right edge of one bar to the left edge of another to create a dependency. See Dependencies for the full model.
Critical path
Tasks on the critical path (longest dependency chain to project completion) get a subtle highlight. Useful for spotting bottlenecks.
Row organization
The Gantt has no group-by control. Bars are organized by the task/subtask hierarchy. (The project's separate By Space view tab groups work by space, but that's not a Gantt grouping.)
Limitations
Gantt works smoothly up to around 500 tasks. For larger plans, filter to the relevant subset.