Widgets
Widgets are the building blocks of a dashboard. Each one is a self-contained panel — a big-number stat, a task list, a chart, a live query, a sticky note — that you drop onto the grid, size, and configure. Mix and match them to build an at-a-glance view of whatever a team needs to watch.
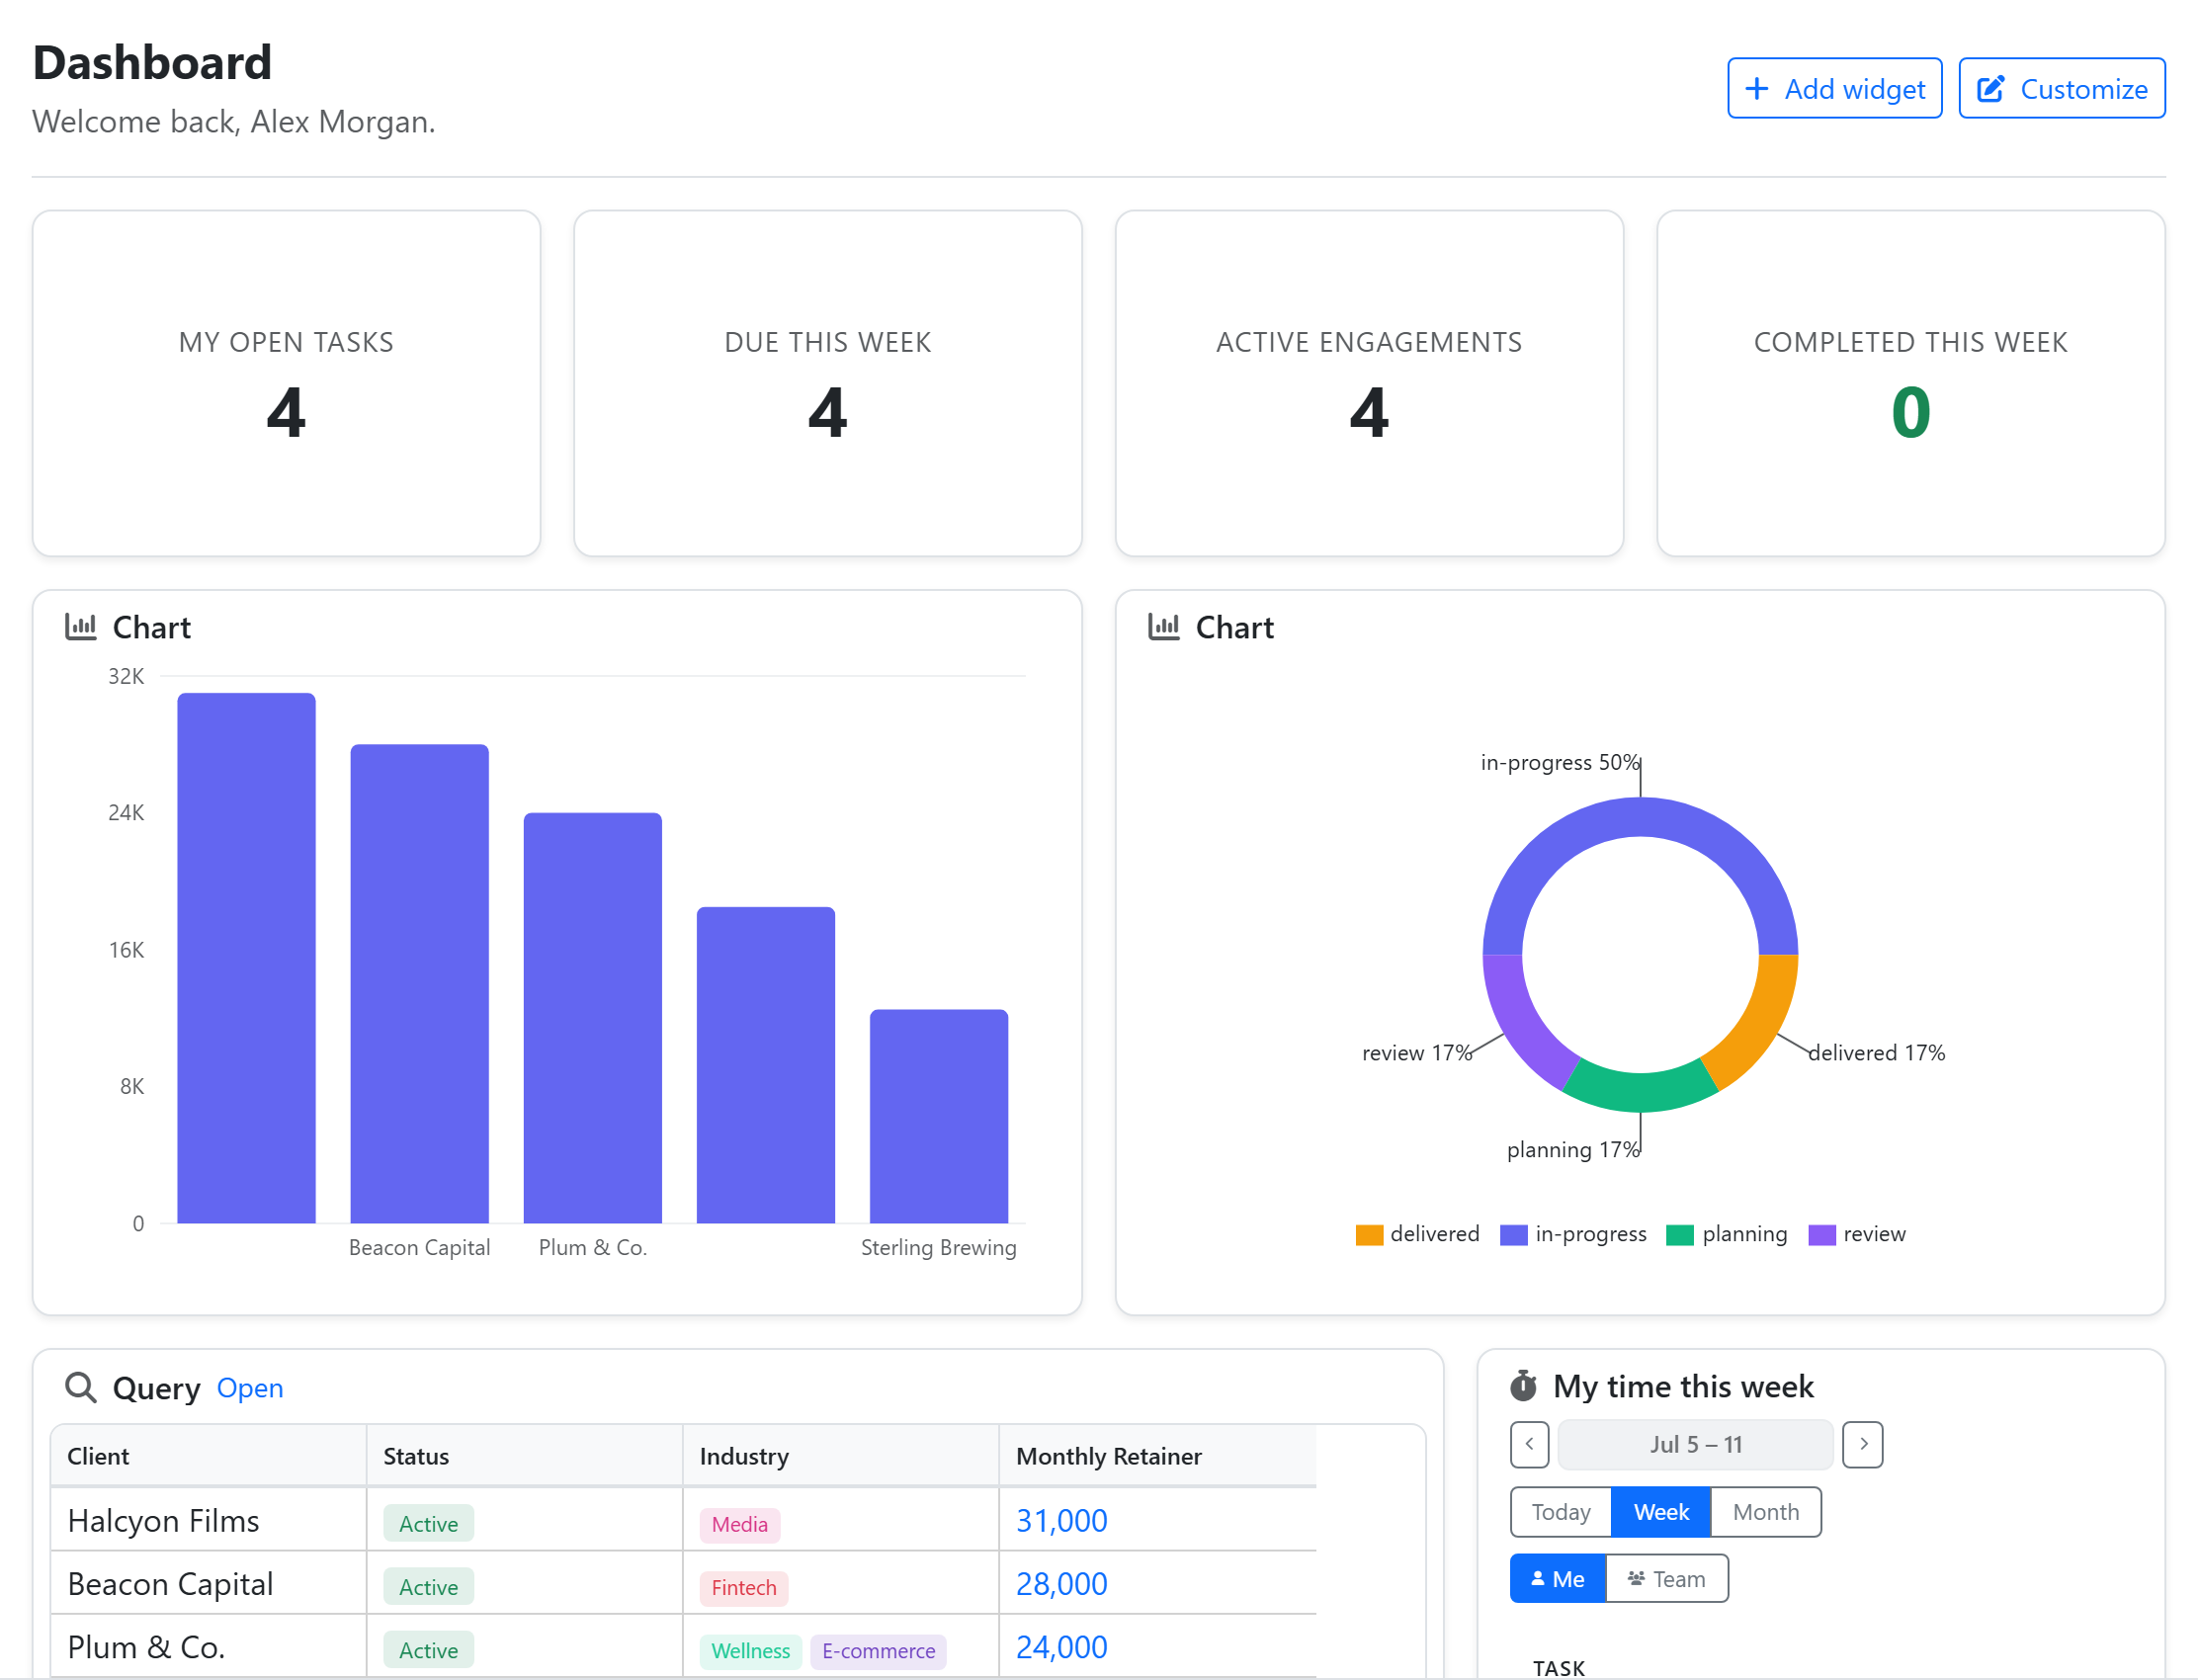
Adding a widget
In the top-right of any dashboard, click Add widget. The picker opens, grouped into Tasks, Data, and Utility, with a search box at the top — start typing to filter by name or description.
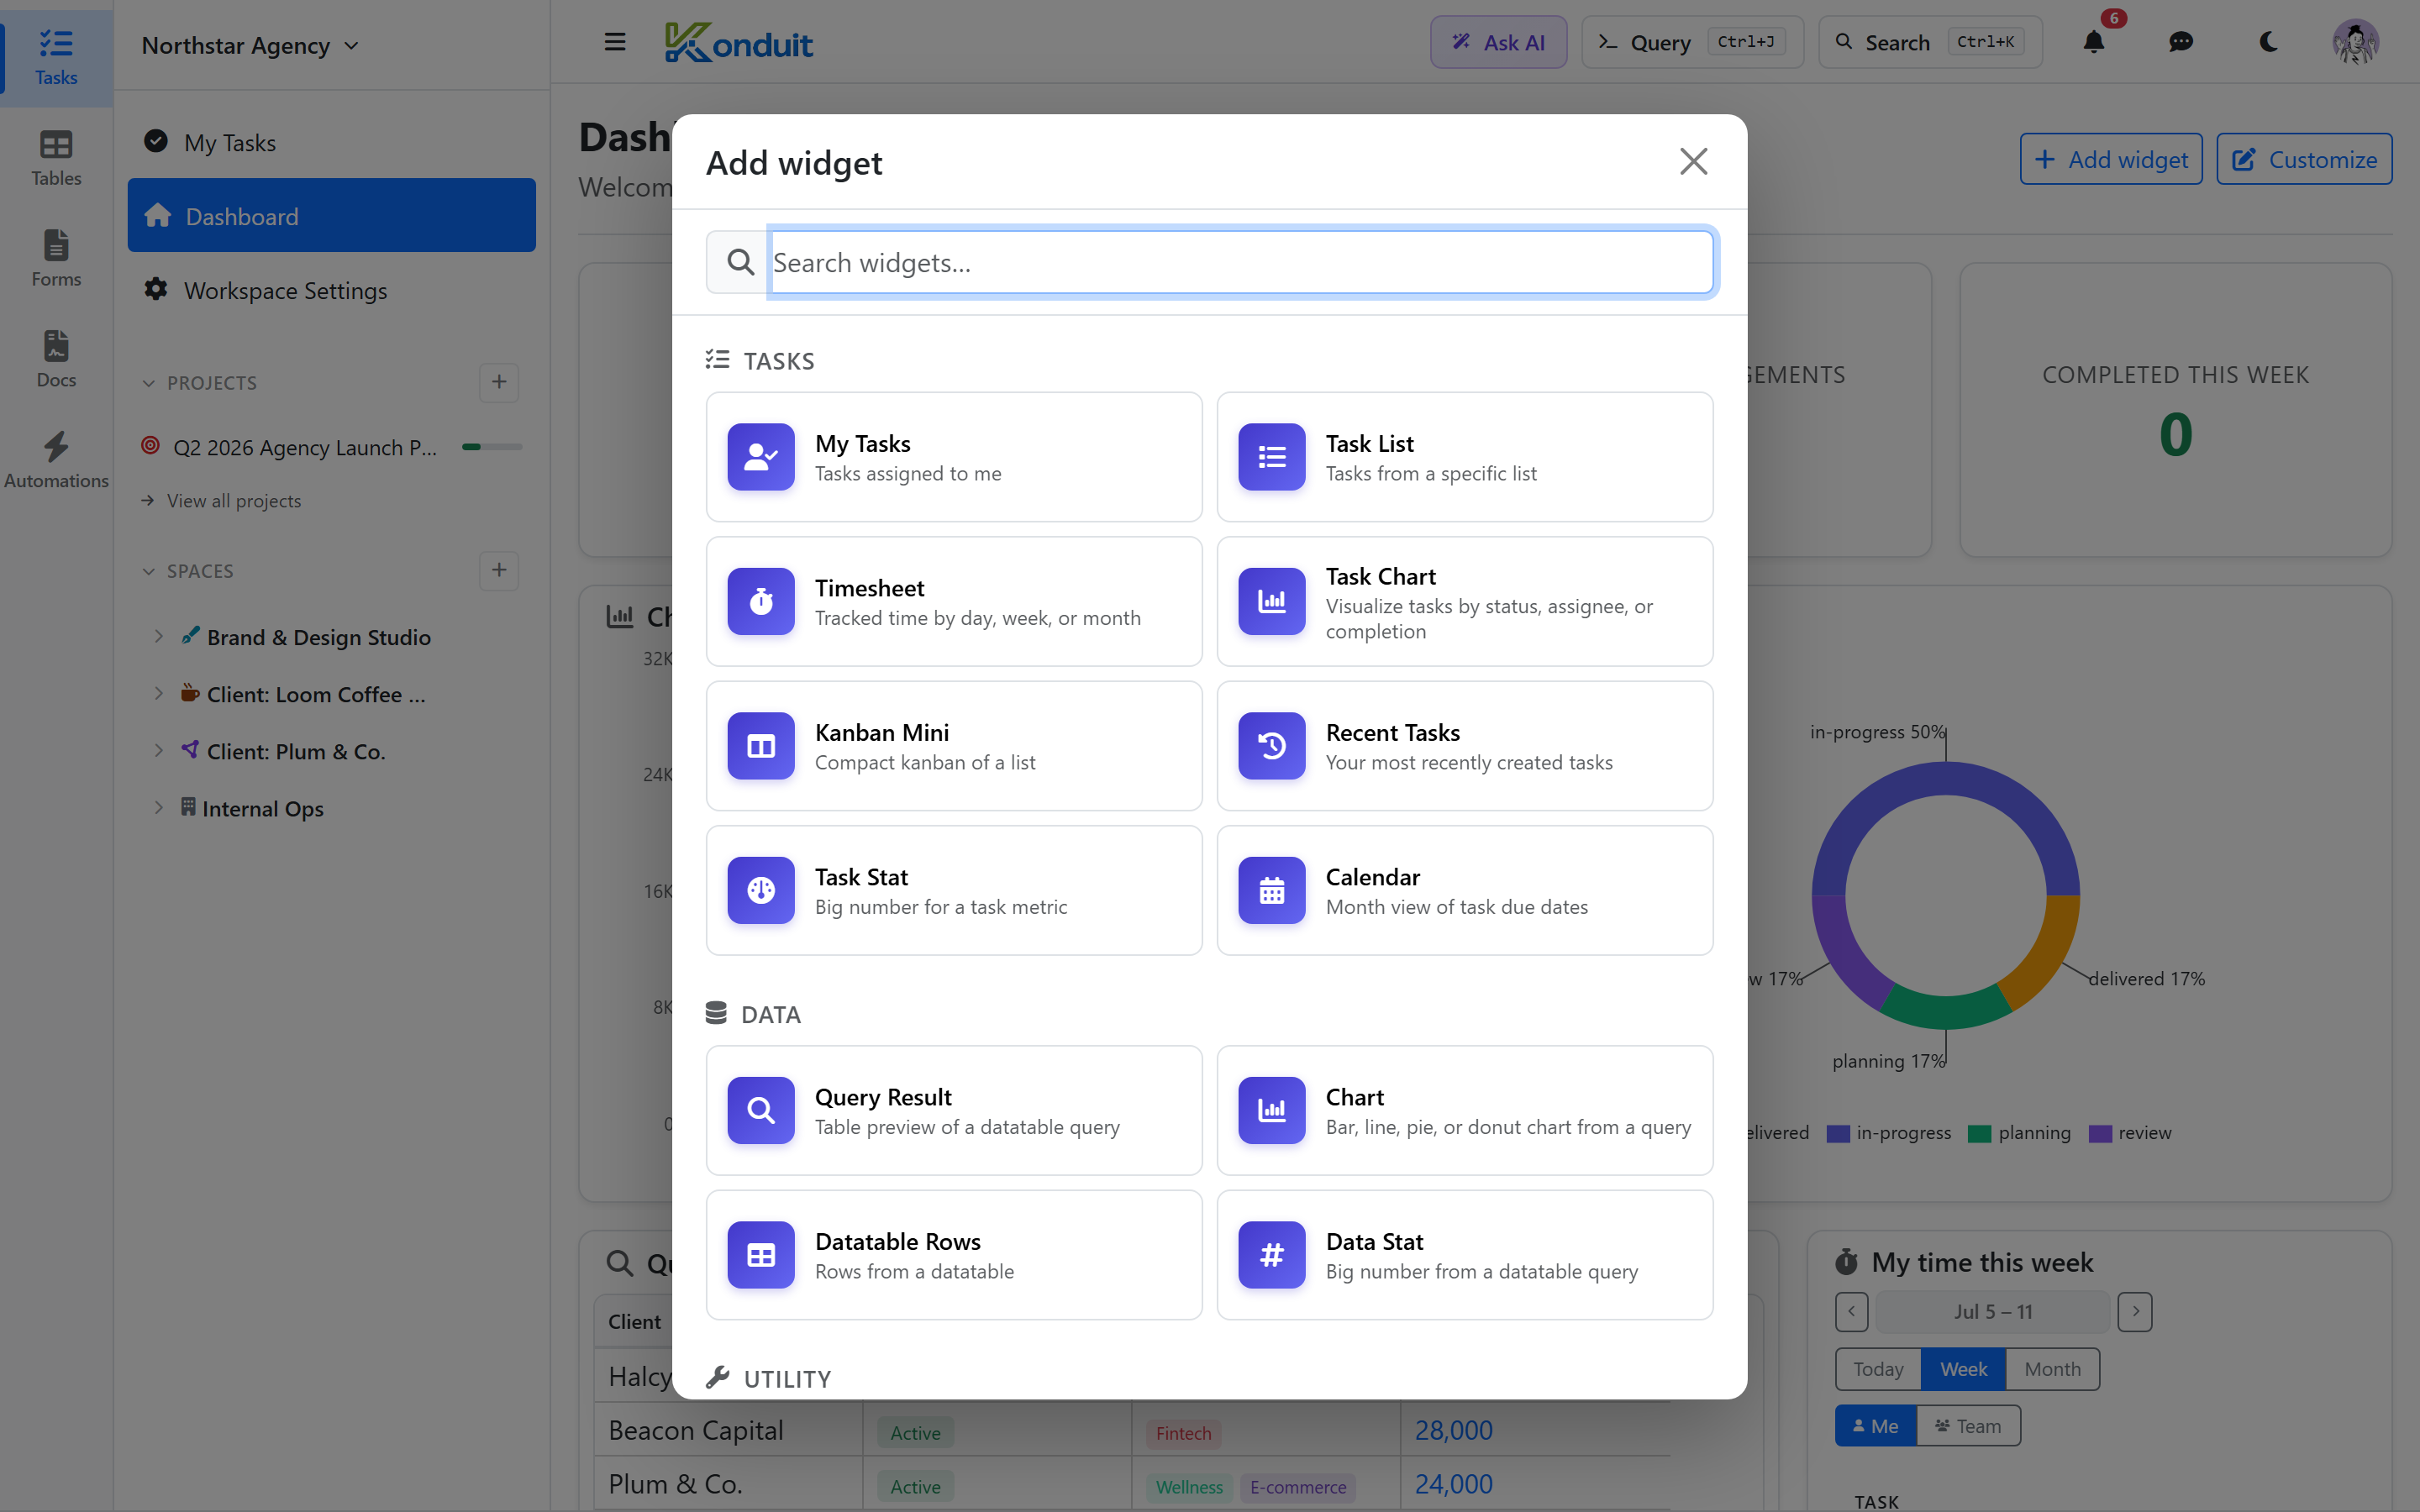
Click a widget to drop it onto the dashboard. It lands with sensible defaults, so it shows real data immediately — then you tune it.
Configuring a widget
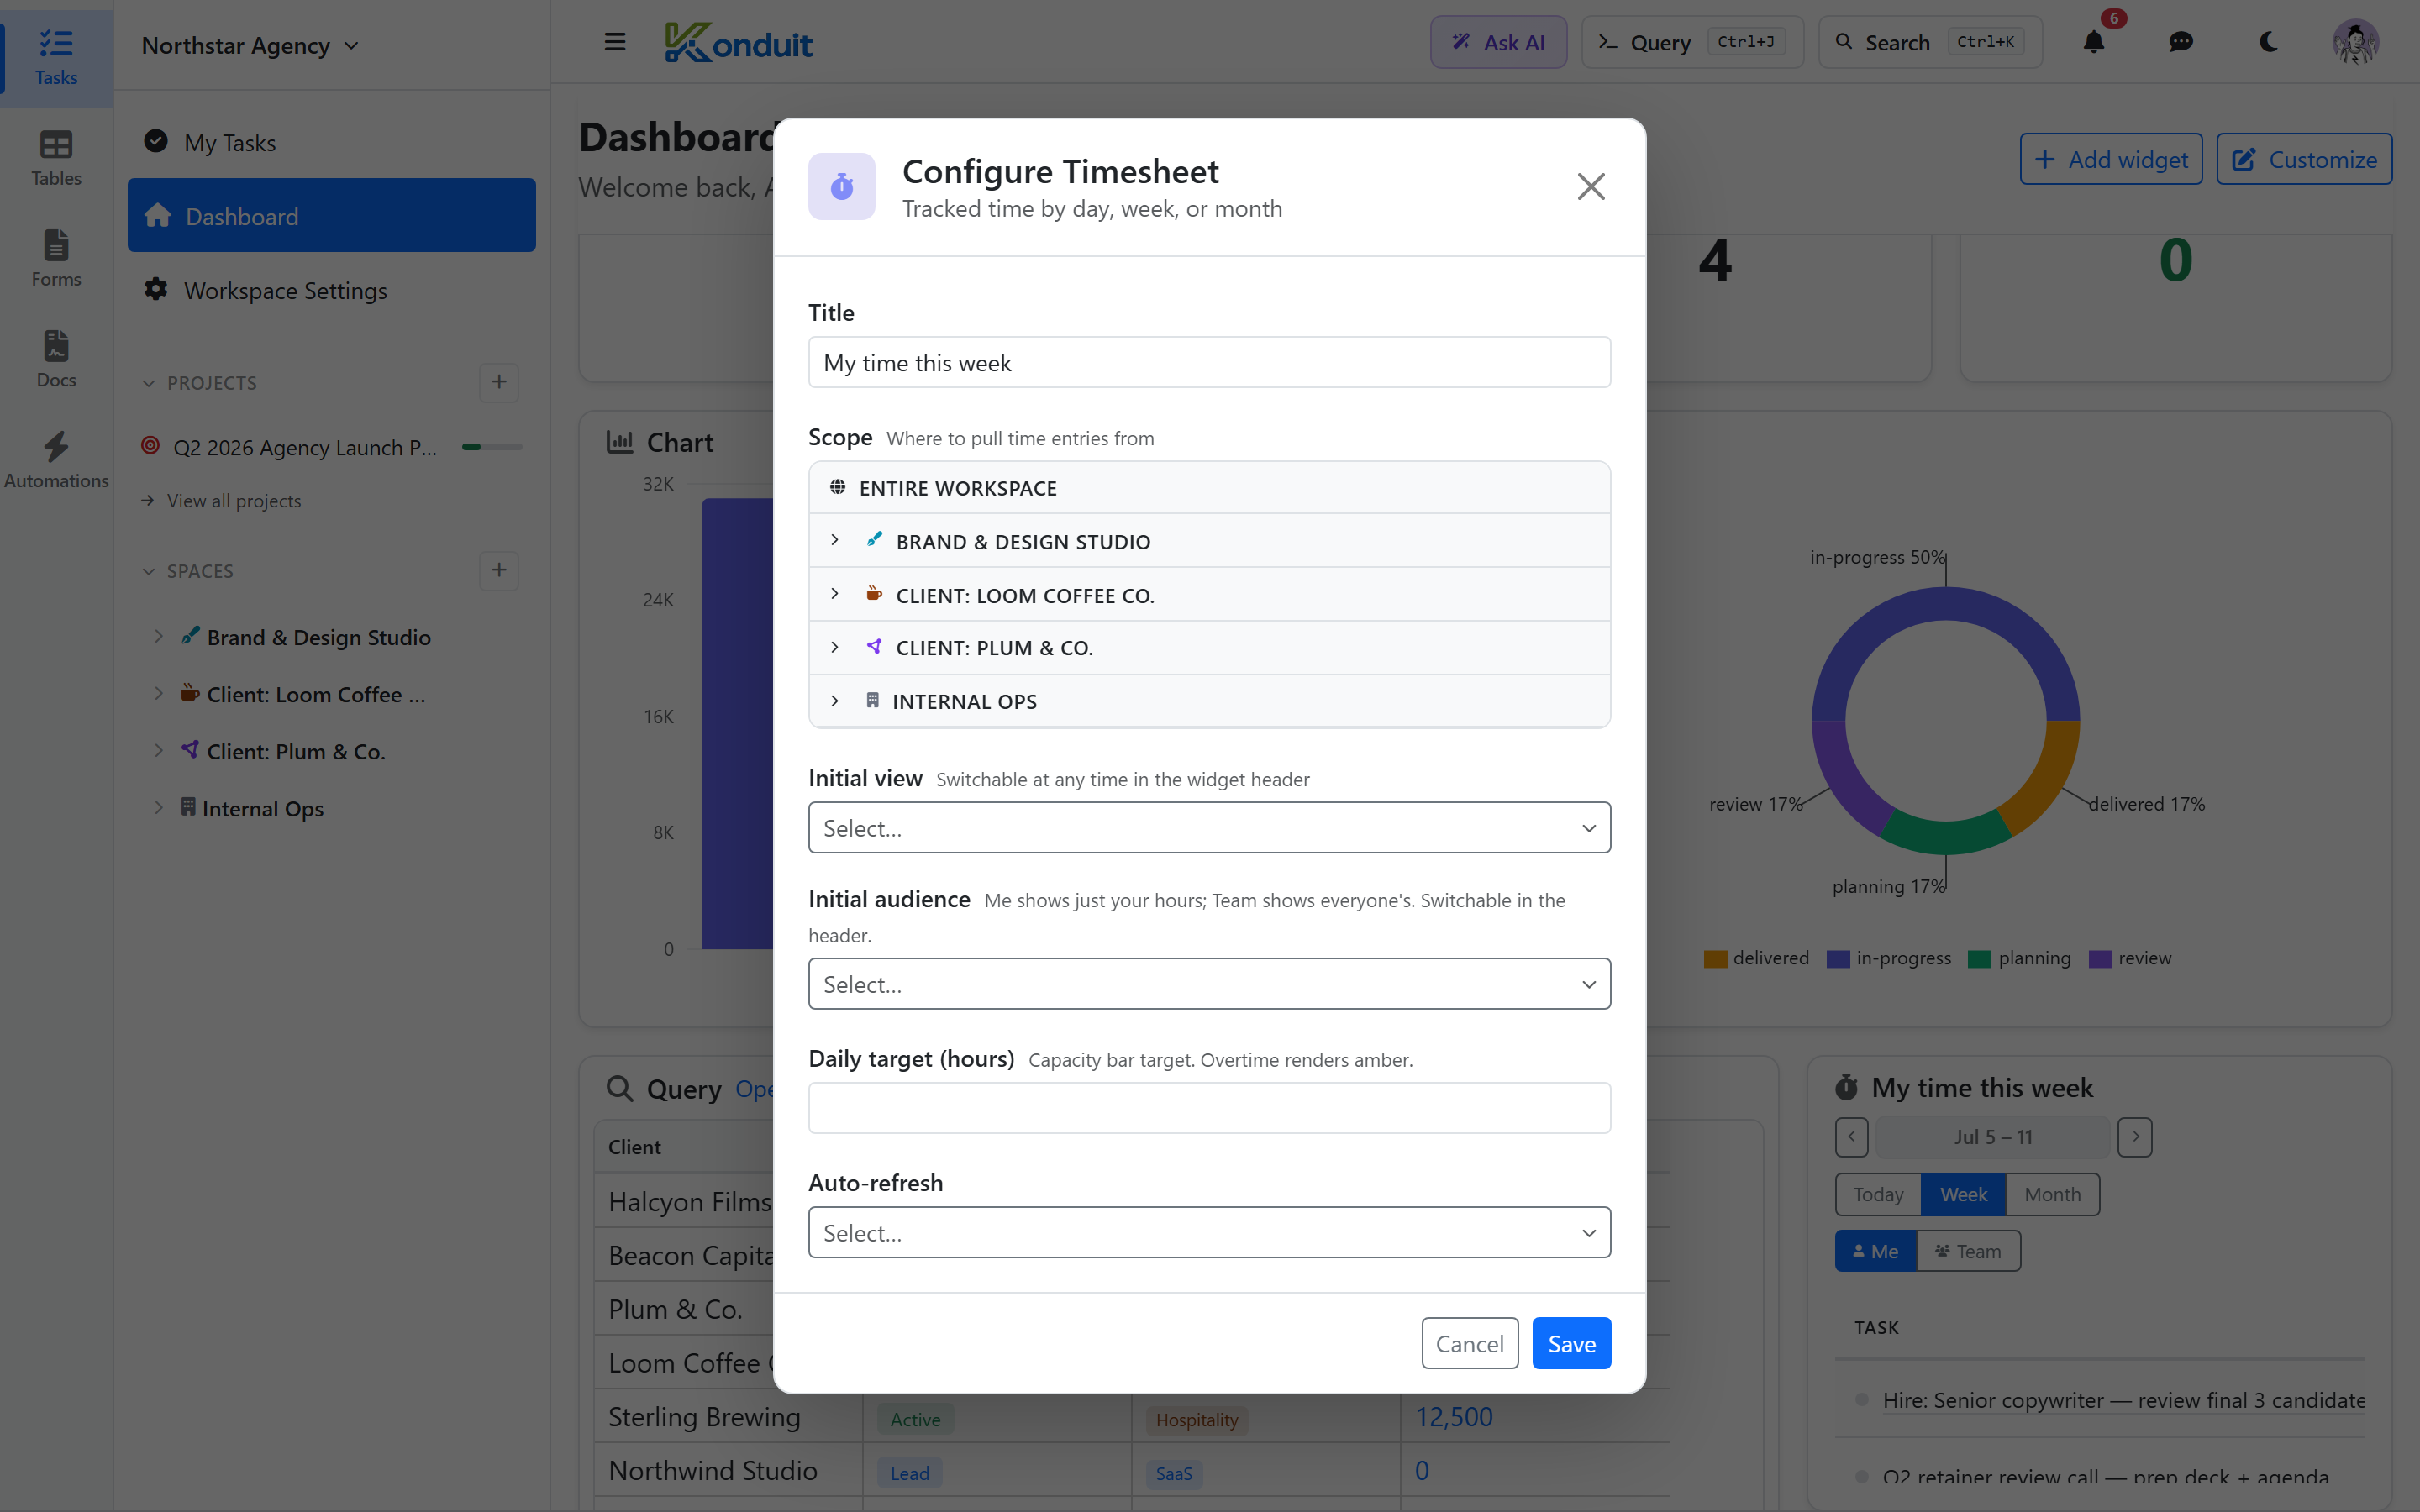
Hover any widget and a small toolbar appears in its top-right corner. Click the gear to open its configuration modal. Every widget has a different set of fields, but they're built from the same handful of input types:
| Field type | What it takes |
|---|---|
| Text | A free-text label — usually a Title to override the widget's default heading |
| Dropdown | A fixed choice — a metric, a chart type, a time range, a sort order |
| Number | A bounded number — a row limit, a daily-hours target |
| Scope | A tree picker — the whole workspace, or a specific space / folder / list to pull data from |
| List / Datatable | A picker that binds the widget to one of your lists or datatables |
Fields appear and disappear based on your other choices — a Task Chart only shows Chart type when you're charting a status breakdown, for example. Change what you need and click Save.
Configuring and deleting work at any time — the gear and trash icons in a widget's hover toolbar don't require any special mode.
Arranging the layout
Moving and resizing widgets happens in layout-edit mode. Click Customize in the top-right (next to Add widget) — it turns into Done while you're editing. In this mode you can drag a widget to reposition it and drag any edge or corner to resize it on the grid; there is no size field in the config modal — sizing is direct-manipulation. Click Done when the layout looks right.
Query-based widgets (Query Result, Chart, Data Stat) are configured differently — instead of the dropdown form, they open an embedded KSQL console where you write and run the query that drives the widget. Save is enabled once the query runs successfully.
The widget catalog
Tasks
My Tasks (my-tasks)
The tasks assigned to you, as a focused personal to-do list.
- Scope — Today & Overdue · Overdue only · Today only · Upcoming · All my tasks
- Max rows — 1–50
Task List (task-list)
A read-only list of tasks from one specific list (no drag-and-drop).
- List — which list to show
- View — optionally point at a saved view inside that list; it inherits the view's filters and sort
- Display name — optional heading override
- Sort by — Due date · Created · Priority (ignored when a View is chosen — the view's sort wins)
- Max rows — 1–50
Timesheet (task-timesheet)
Tracked-time totals over a period, with a capacity bar. See Time Tracking.
- Title — heading override
- Scope — where to pull time entries from
- Initial view — Today · Week (task × day grid) · Month (week-by-week totals) (switchable in the widget header)
- Initial audience — Me · Team (switchable in the header)
- Daily target (hours) — 1–24; the capacity bar fills to this, and overtime renders amber
- Auto-refresh — Off · 1 min · 5 min · 15 min · 1 hr
Task Chart (task-chart)
A chart of task metrics. The controls change with the metric you pick.
- Title — heading override
- What to chart — Status breakdown · Assignee workload · Completed tasks (by person)
- Scope — where to pull tasks from
- Chart type (status breakdown) — Donut · Pie · Bar
- Show (status breakdown) — All statuses · Open only · Completed / Cancelled only
- Show (assignee workload) — All open · In progress · Not started · Overdue · Urgent & High · All
- Stack by status (assignee workload) — split each person's bar into not-started / active / done
- Average reference line (assignee workload) — draw the team average
- Time range (completed report) — Last 7 / 30 / 90 days · This week · This month
- Auto-refresh — Off · 1 min · 5 min · 15 min · 1 hr
Kanban Mini (kanban-mini)
A compact status board for a list, embedded on the dashboard.
- List — which list to board
- Display name — optional heading override
Recent Tasks (activity-feed)
Your most recently created tasks — a quick "what's new" panel.
- Title — heading override
- Max items — 1–30
Task Stat (task-stat)
A single big number for a task metric. Place several side by side for a KPI row.
- Metric — My open · My overdue · My due today · My upcoming · My completed this week · All overdue · All unassigned
- Label — optional display label under the number
- Scope — where to count from (shown only for the workspace-wide metrics: All overdue, All unassigned)
- Auto-refresh — Off · 1 min · 5 min · 15 min · 1 hr
Calendar (calendar)
Tasks laid out on a monthly calendar by their due dates.
- Title — heading override
- Upcoming list — show or hide the upcoming-tasks side list
Data
Query Result (query-result)
A KSQL query rendered inline as a table.
- Query — written in the embedded SQL console (returns up to 500 rows)
Use for: recent orders, customers needing follow-up, top expenses.
Chart (chart)
A bar, line, pie, or donut chart driven by a KSQL query.
- Query — the SQL that produces the data
- Chart type — bar · line · pie · donut
- X axis — the label column
- Y series — one numeric column (simple chart) or several (grouped or stacked bar / multi-line)
Use for: revenue over time, tasks per assignee, tier distribution.
Datatable Rows (datatable-rows)
Rows straight from a datatable — no query needed.
- Datatable — which table to show
- Display name — optional heading override
- Max rows — 1–50
Data Stat (datatable-stat)
A single big number computed from a datatable query.
- Query — the SQL to run
- Aggregation — how to reduce it to one number (count, sum, …)
- Label — the caption under the number
Use for: total inventory value, count of active customers, unsold units.
Utility
Note (note)
A freeform sticky note for headings, context, links, or reminders.
- Title — heading override
- Color — Yellow · Blue · Green · Pink · Plain
The note body is edited directly in the widget — click in and type.
Good to know
- Charts support bar, line, pie, and donut only — there's no stacked-area chart.
- There's no separate "KPI grid" widget — place several Task Stat or Data Stat tiles side by side.
- Auto-refresh is opt-in per widget and defaults to Off; data still refreshes when you load or return to the dashboard.
- Widgets that read a list or datatable stay live — they reflect edits to the underlying data without re-configuring.
Next
- Dashboards — arranging widgets into a view
- Routines — email a query result on a schedule
- KSQL — the query language behind the data widgets